Syncfusion Flutter Charts
Syncfusion Flutter Charts is a data visualization library written natively in Dart for creating beautiful and high-performance charts, which are used to craft high-quality mobile app user interfaces using Flutter.

Overview
Create various types of cartesian or circular charts with seamless interaction, responsiveness, and smooth animation. It has a rich set of features, and it is completely customizable and extendable.
Disclaimer: This is a commercial package. To use this package, you need to have either Syncfusion Commercial License or Syncfusion Community license. For more details, please check the LICENSE file.
Note: Our packages are now compatible with Flutter for Web. However, this will be in Beta until Flutter for Web becomes stable.
Table of contents
- Chart features
- Get the demo application
- Useful links
- Installation
- Getting started
- Support and Feedback
- About Syncfusion
Chart features
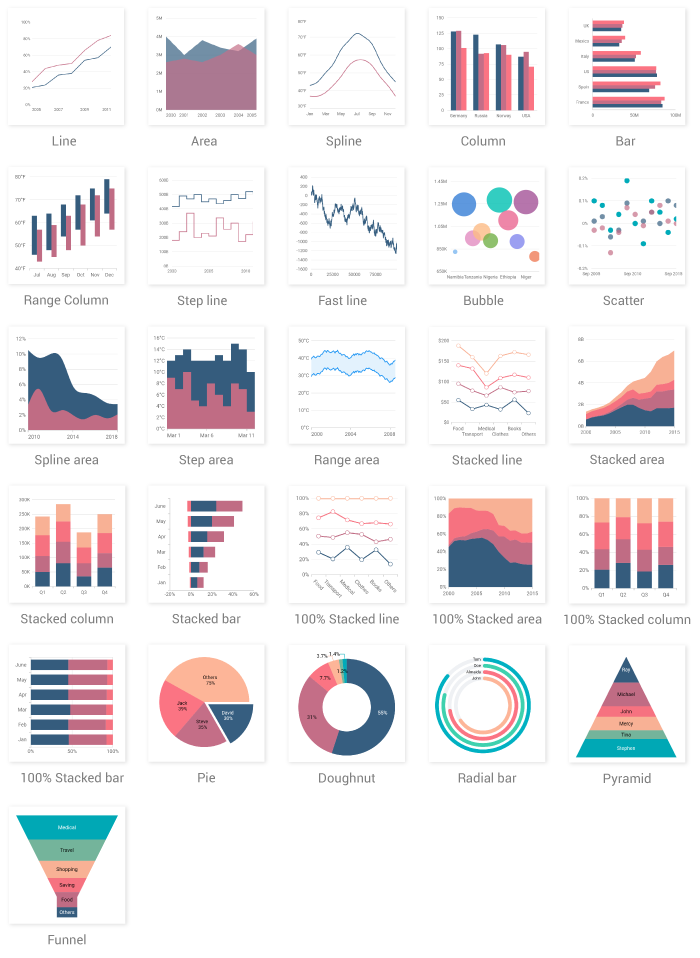
- Chart types – Provides functionality for rendering 25+ chart types, namely line, spline, column, bar, area, bubble, scatter, step line, fast line, range column, range area, step area, spline area, stacked charts, 100% stacked charts, pie, doughnut, radial bar, pyramid, funnel, etc. Each chart type is easily configured and customized with built-in features for creating stunning visual effects.
- Axis types – Plot various types of data in a graph with the help of numeric, category, date-time and log axis types. The built-in axis features allow to customize an axis elements further to make the axis more readable.

- User interaction – The end-user experience is greatly enhanced by including the user interaction features such as zooming and panning, crosshair, trackball, events, selection, and tooltip in chart.

- Legends – Display additional information about the chart series. The chart legend can also be used to collapse the series. The legends can be wrapped or scrolled if an item exceeds the available bounds.
- Dynamic update – Updates the chart dynamically with live data that changes over seconds or minutes like stock prices, temperature, speed, etc.
Get the demo application
Explore the full capabilities of our Flutter widgets on your device by installing our sample browser applications from the below app stores, and view samples code in GitHub.


Other useful links
Take a look at the following to learn more about Syncfusion Flutter charts:
Installation
Install the latest version from pub.
Getting started
Import the following package.
import 'package:syncfusion_flutter_charts/charts.dart';
Add chart to the widget tree
Add the chart widget as a child of any widget. Here, the chart widget is added as a child of container widget.
@override
Widget build(BuildContext context) {
  return Scaffold(
    body: Center(
        child: Container(
          child: SfCartesianChart(
          )
        )
      )
  );
}
Bind data source
Based on data, initialize the appropriate axis type and series type. In the series, map the data source and the fields for x and y data points. To render a line chart with category axis, initialize appropriate properties.
@override
Widget build(BuildContext context) {
  return Scaffold(
    body: Center(
        child: Container(
          child: SfCartesianChart(
            // Initialize category axis
            primaryXAxis: CategoryAxis(),

            series: <LineSeries<SalesData, String>>[
              LineSeries<SalesData, String>(
                // Bind data source
                dataSource:  <SalesData>[
                  SalesData('Jan', 35),
                  SalesData('Feb', 28),
                  SalesData('Mar', 34),
                  SalesData('Apr', 32),
                  SalesData('May', 40)
                ],
                xValueMapper: (SalesData sales, _) => sales.year,
                yValueMapper: (SalesData sales, _) => sales.sales
              )
            ]
          )
        )
      )
  );
}

class SalesData {
  SalesData(this.year, this.sales);
  final String year;
  final double sales;
}
Note
- Use
SfCartesianChartwidget to render line, spline, area, column, bar, bubble, scatter, step line, and fast line charts. - Use
SfCircularChartwidget to render pie, doughnut, and radial bar charts. - Use
SfPyramidChartandSfFunnelChartto render pyramid and funnel charts respectively.
Add chart elements
Add the chart elements such as title, legend, data label, and tooltip to display additional information about the data plotted in the chart.
@override
Widget build(BuildContext context) {
  return Scaffold(
    body: Center(
        child: Container(
          child: SfCartesianChart(

            primaryXAxis: CategoryAxis(),
            // Chart title
            title: ChartTitle(text: 'Half yearly sales analysis'),
            // Enable legend
            legend: Legend(isVisible: true),
            // Enable tooltip
            tooltipBehavior: TooltipBehavior(enable: true),

            series: <LineSeries<SalesData, String>>[
              LineSeries<SalesData, String>(
                dataSource:  <SalesData>[
                  SalesData('Jan', 35),
                  SalesData('Feb', 28),
                  SalesData('Mar', 34),
                  SalesData('Apr', 32),
                  SalesData('May', 40)
                ],
                xValueMapper: (SalesData sales, _) => sales.year,
                yValueMapper: (SalesData sales, _) => sales.sales,
                // Enable data label
                dataLabelSettings: DataLabelSettings(isVisible: true)
              )
            ]
          )
        )
      )
  );
}
The following screenshot illustrates the result of the above code sample.
Syncfusion Flutter Examples
This repository contains the demos of Syncfusion Flutter UI widgets. This is the best place to check our widgets to get more insight about the usage of APIs. You can also check our widgets by installing the sample browser applicationfrom Google Play Store, in which you can browse the demos for all the available widgets and view the source code of each example within the app itself.

This section guides you how to use the Syncfusion Flutter examples in your applications.
Table of contents
- Requirements to run the demo
- Repository structure
- Using the samples
- Support and feedback
- Screenshots
- Disclaimer
- About Syncfusion
Requirements to run the demo
- Flutter SDK
- Android studio or Visual studio code
- Install Flutter extension in Android studio or in VS code
Repository structure
This repository contains sample browser project. Each widgets sample will be found inside the lib/samples folder. Run this project to see the demo samples of all the Flutter widgets in single application.
Using the samples
- Download or clone the files in repository.
- Get the required packages referred in the project.
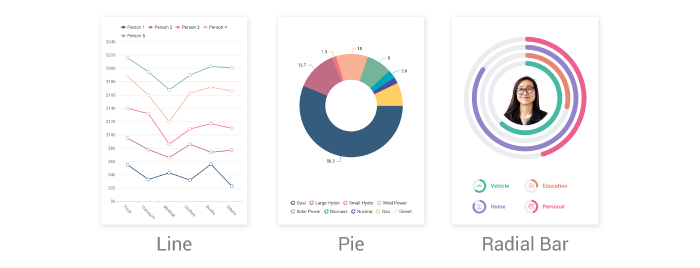
Screenshots
Chart types
Axis types
User interactions
Disclaimer
Syncfusion has no liability for any damage or consequence that may arise by the use or viewing of the examples. The examples are for demonstrative purposes and if you choose to use or access the examples you agree to not hold Syncfusion liable, in any form, for any damage that is related to use, accessing or otherwise viewing the examples. By accessing, viewing, or otherwise seeing the examples you acknowledge and agree Syncfusion’s examples will not allow you to seek injunctive relief in any form for any claim related to the sample. If you do not agree to this, do not view, access, utilize or otherwise do anything with Syncfusion’s examples.
Download Syncfusion Flutter Examples app source code on GitHub
Import Syncfusion Flutter Charts on Pub
Provides the list of the opensource Flutter apps collection with GitHub repository.