Syncfusion Flutter Maps
Syncfusion Flutter Maps is a data visualization library written natively in Dart for creating beautiful and customizable maps from GeoJSON data. They are used to build high-performance mobile applications with rich UIs using Flutter.

Overview
Create a highly interactive and customizable maps widget that has features such as data labels, selection, markers, bubbles, assignable colors based on region, and legends.
Disclaimer: This is a commercial package. To use this package, you need to have either a Syncfusion commercial license or Syncfusion Community License. For more details, please check the LICENSE file.
Note: Our packages are now compatible with Flutter for Web. However, this will be in beta until Flutter for web becomes stable.
Table of contents
- Maps features
- Get the demo application
- Useful links
- Installation
- Getting started
- Add maps to the widget tree
- Add a GeoJSON file
- Mapping the data source
- Add maps elements
- Support and Feedback
Maps features
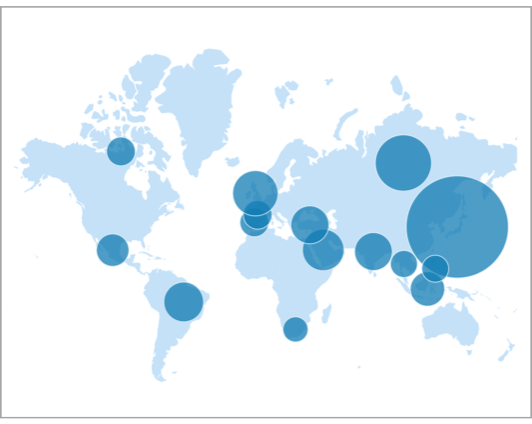
Bubbles – Add information to shapes, such as population density and number of users. Bubbles can be rendered in different colors and sizes based on the data values of that shape.
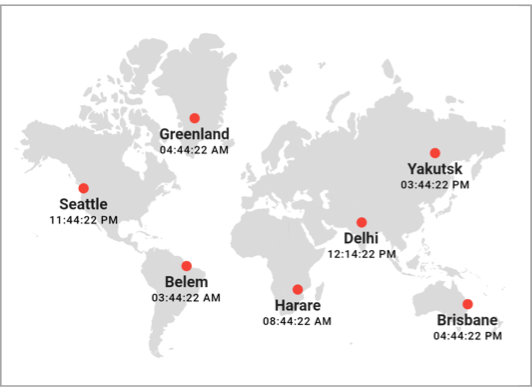
Markers – Denote a place with built-in symbols or display a custom widget at specific a latitude and longitude on a map.
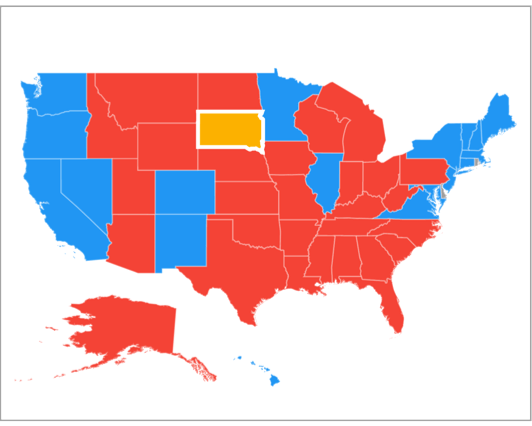
Shape selection – Select a shape in order to highlight that area on a map. You can use the callback for doing any action during shape selection.
Legend – Use legends to provide clear information on the data plotted in the map. You can use the legend toggling feature to visualize only the shapes that need to be interpreted.
Colors – Categorize the shapes on a map by customizing their color based on the underlying value. It is possible to set the shape color for a specific value or for a range of values.
Tooltip – Display additional information about the shapes and bubbles using a customizable tooltip on a map.
Get the demo application
Explore the full capability of our Flutter widgets on your device by installing our sample browser application from the following app stores. View sample codes in GitHub.
Useful links
Take a look at the following to learn more about Syncfusion Flutter Maps:
Installation
Install the latest version from pub.
Getting started
Import the following package.
import 'package:syncfusion_flutter_maps/maps.dart';
Add maps to the widget tree
After importing the package, initialize the maps widget as a child of any widget.
@override
Widget build(BuildContext context) {
  return Scaffold(
    body: Center(
      child: SfMaps(),
    ),
  );
}
Add a GeoJSON file
The layers in SfMaps contains collection of MapShapeLayer. The actual geographical rendering is done in the each MapShapeLayer. The delegate property of the MapShapeLayer is of type MapShapeLayerDelegate. The path of the .json file which contains the GeoJSON data has to be set to the shapeFile property of the MapShapeLayerDelegate.
The shapeDataField property of the MapShapeLayerDelegate is used to refer the unique field name in the .json file to identify each shapes. In ‘Mapping the data source’ section of this document, this shapeDataField will be used to map with respective value returned in primaryValueMapper from the data source.
@override
Widget build(BuildContext context) {
  return Scaffold(
    body: SfMaps(
      layers: [
        MapShapeLayer(
          delegate: const MapShapeLayerDelegate(
            shapeFile: 'assets/australia.json',
            shapeDataField: 'STATE_NAME',
          ),
        ),
      ],
    ),
  );
}
Mapping the data source
By default, the value specified for the shapeDataField in the GeoJSON file will be used in the elements like data labels, tooltip, and legend for their respective shapes. However, it is possible to keep a data source and customize these elements based on the requirement. As mentioned above, shapeDataField will be used to map with respective value returned in primaryValueMapper from the data source.
List<Model> data;

@override
void initState() {
  data = <Model>[
    Model('New South Wales',
     '       New\nSouth Wales'),
    Model('Queensland', 'Queensland'),
    Model('Northern Territory', 'Northern\nTerritory'),
    Model('Victoria', 'Victoria'),
    Model('South Australia', 'South Australia'),
    Model('Western Australia', 'Western Australia'),
    Model('Tasmania', 'Tasmania'),
    Model('Australian Capital Territory', 'ACT')
  ];

  super.initState();
}

@override
Widget build(BuildContext context) {
  return Scaffold(
    body: SfMaps(
       layers: <MapShapeLayer>[
         MapShapeLayer(
           delegate: MapShapeLayerDelegate(
             shapeFile: 'assets/australia.json',
             shapeDataField: 'STATE_NAME',
             dataCount: data.length,
             primaryValueMapper: (int index) => data[index].state,
           ),
         ),
       ],
     ),
   );
}

class Model {
  Model(this.state, this.stateCode);

  String state;
  String stateCode;
}
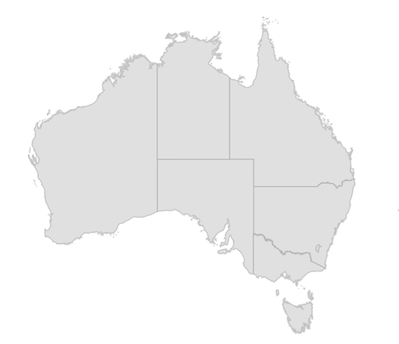
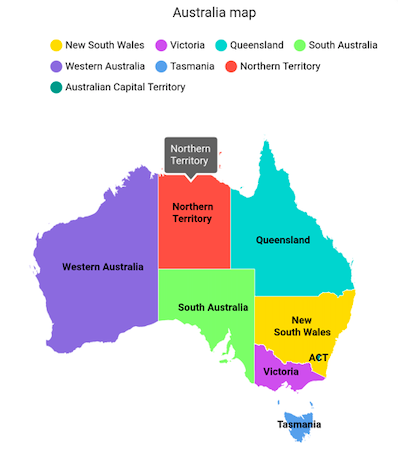
Add maps elements
Add the basic maps elements such as title, data labels, legend, and tooltip as shown in the below code snippet.
- Title – You can add a title to the maps to provide a quick information about the data plotted in the map using the
titleproperty in theSfMaps. - Data label – You can show data labels using the
showDataLabelsproperty in theMapShapeLayerand also, it is possible to show data labels only for the particular shapes/or show custom text using thedataLabelMapperproperty in theMapShapeLayerDelegate. - Legend – You can show legend using the
showLegendproperty in theMapShapeLayer. The icon color of the legend is applied based on the color returned in theshapeColorValueMapperproperty in theMapShapeLayerDelegate. It is possible to customize the legend item’s color and text using theshapeColorMappersproperty in theMapShapeLayerDelegate. - Tooltip – You can enable tooltip for the shapes using the
enableShapeTooltipproperty in theMapShapeLayerand also, it is possible to enable tooltip only for the particular shapes/or show custom text using theshapeTooltipTextMapperproperty in theMapShapeLayerDelegate.
List<Model> data;

@override
void initState() {
  data = <Model>[
    Model('New South Wales', Color.fromRGBO(255, 215, 0, 1.0),
        '       New\nSouth Wales'),
    Model('Queensland', Color.fromRGBO(72, 209, 204, 1.0), 'Queensland'),
    Model('Northern Territory', Colors.red.withOpacity(0.85),
        'Northern\nTerritory'),
    Model('Victoria', Color.fromRGBO(171, 56, 224, 0.75), 'Victoria'),
    Model('South Australia', Color.fromRGBO(126, 247, 74, 0.75),
        'South Australia'),
    Model('Western Australia', Color.fromRGBO(79, 60, 201, 0.7),
        'Western Australia'),
    Model('Tasmania', Color.fromRGBO(99, 164, 230, 1), 'Tasmania'),
    Model('Australian Capital Territory', Colors.teal, 'ACT')
  ];
  super.initState();
}

@override
Widget build(BuildContext context) {
  return Scaffold(
    body: Container(
      height: 520,
      child: Center(
        child: SfMaps(
          title: const MapTitle(text: 'Australia map'),
          layers: <MapShapeLayer>[
            MapShapeLayer(
              delegate: MapShapeLayerDelegate(
                shapeFile: 'assets/australia.json',
                shapeDataField: 'STATE_NAME',
                dataCount: data.length,
                primaryValueMapper: (int index) => data[index].state,
                dataLabelMapper: (int index) => data[index].stateCode,
                shapeColorValueMapper: (int index) => data[index].color,
                shapeTooltipTextMapper: (int index) => data[index].stateCode,
              ),
              showDataLabels: true,
              showLegend: true,
              enableShapeTooltip: true,
              tooltipSettings: MapTooltipSettings(color: Colors.grey[700],
                  strokeColor: Colors.white, strokeWidth: 2
              ),
              strokeColor: Colors.white,
              strokeWidth: 0.5,
              dataLabelSettings: MapDataLabelSettings(
                  textStyle: TextStyle(
                      color: Colors.black,
                      fontWeight: FontWeight.bold,
                      fontSize:
                      Theme
                          .of(context)
                          .textTheme
                          .caption
                          .fontSize)),
            ),
          ],
        ),
      ),
    ),
  );
}

class Model {
  Model(this.state, this.color, this.stateCode);

  String state;
  Color color;
  String stateCode;
}
The following screenshot illustrates the result of the above code sample.
Check out the detaila and deplyment of this package on pub
https://pub.dev/packages/syncfusion_flutter_maps
Provides the list of the opensource Flutter apps collection with GitHub repository.